
AI Data Analysis
Build a data foundation that becomes your competitive strength.
How do you build the source of competitive strength? First we build the activity-DB layer—gathering scattered data, cleaning it, and keeping it stored. On top of it, analysis such as site improvement and defect detection generates competitive strength. We don't stop at analysis—we connect it through to development and operations as one continuous flow.
ARCHITECTURE
Our vision for building a competitive foundation
Every IPLoT product and service takes a place in this shared OS of competitive strength. AI Data Analysis covers the highlighted part (Activity-DB layer).
How IPLoT supports this model
The areas covered by each IPLoT product and service within the model above.
| Layer | Products & services in charge |
|---|---|
| Structured-UI layer (the window) | Brain Pro / Shiftly / System development |
| Knowledge layer (what AI is taught) | iPro Manual / AI Strategist Training / Competitive Foundation Consulting |
| Activity-DB layer (store the data) | AI Data Analysis / Yomitoru-kun / Wholesale core system |
| Agent layer (where AI acts) | IPRO-kun / Menta-kun / System development |
| Designing & applying the whole structure | IT consulting (overall design) / HRobo (all layers for HR & talent) / Competitive Foundation Consulting (full rollout) |
AI Data Analysis covers: Activity-DB layer
CHALLENGE
Why data alone doesn't move the business
Machine logs, inspection records, orders, inventory—the data keeps piling up, yet no action comes out of it. IPLoT's data-analysis service starts from building the foundation that stores your data, then combines hands-on analysis from goal-setting onward with a tool your team can run, so those numbers turn into results.
Four walls that keep data from paying off
- Data is scattered across core systems, SaaS, spreadsheets and paper—not stored in an analysable form
- No one who can analyse—data scientists are expensive and hard to hire
- BI dashboards made things visible, but never produced the next move
- Analysis depends on one person—no one can reproduce or take it over

─ DATA ANALYSIS
all the way to the next move.
OVERVIEW
The service at a glance: build the activity-DB layer, then turn it into strength
The service follows the shared architecture (diagram above): one activity builds the activity-DB layer that stores your data; the other turns the stored records into competitive strength through analysis. Choose how we proceed—hands-on from goal-setting onward, or a tool AI runs automatically.
Store the data—build the activity-DB layer
We gather and clean data scattered across core systems, SaaS, spreadsheets, paper and sensors, into an activity-DB layer the whole company can see and that keeps accumulating.
Generate strength—analysis on the stored data
Grounded in the stored records, analysis such as site improvement, defect detection and failure prediction produces concrete moves that build competitive strength.
How we proceed (self-serve or hands-on)
Data is scattered
Want the storing (foundation) handled too → hands-on
Not sure what to look at
Start from framing the questions → hands-on
Want to run it yourselves
Routine analysis you want AI to automate → the tool
Common deliverable
Charts + a report with recommended actions
FOUNDATION ・ 01 STORE THE DATA
Building the activity-DB layer—how your data gets stored
The main reason analysis stalls is not method—it's that the data is scattered everywhere. We gather the numbers spread across core systems, SaaS, spreadsheets, paper and departments, clean them up, and get the whole company looking at the same figures. We take on this pre-analysis stage, made to order, end to end.
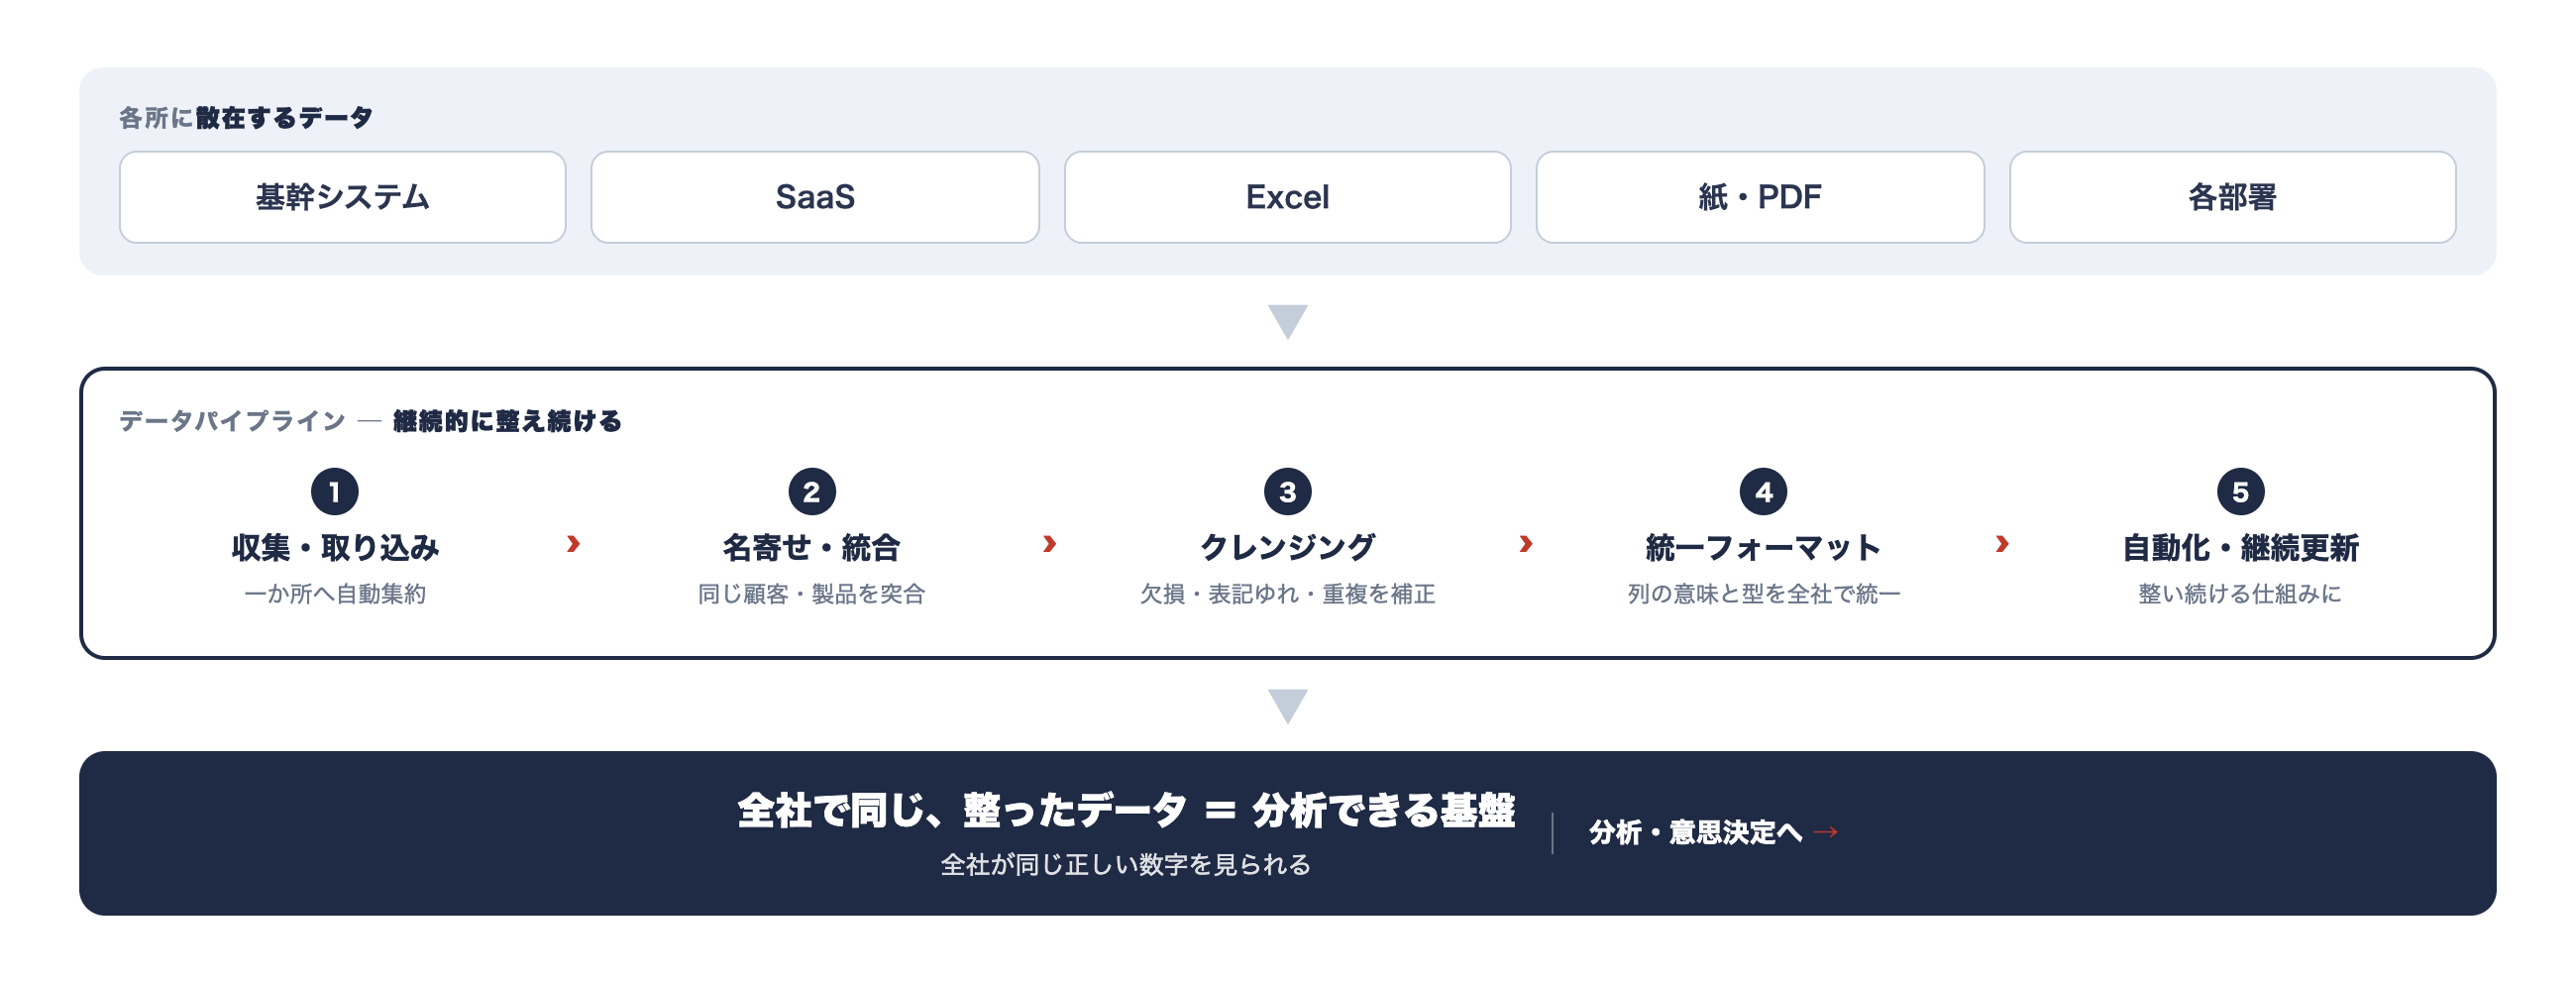
Six steps to an analysable foundation
Gather the scattered data
Bring core-system, SaaS, spreadsheet, paper and departmental numbers into one place; stop manual re-keying
Dedupe and integrate
Match the same customers and part numbers across separate ledgers and merge them
Cleanse
Fix gaps, inconsistent notation and duplicates until the data can be counted and analysed
Set a unified format
Align column meanings and types into one company-wide schema
Make it stay clean
Automate collection and shaping into a pipeline—no more fixing by hand every time
One source of truth for everyone
The whole company sees the same correct numbers—a foundation ready for analysis
METHOD ・ 02 ANALYSIS THAT GENERATES STRENGTH (HANDS-ON)
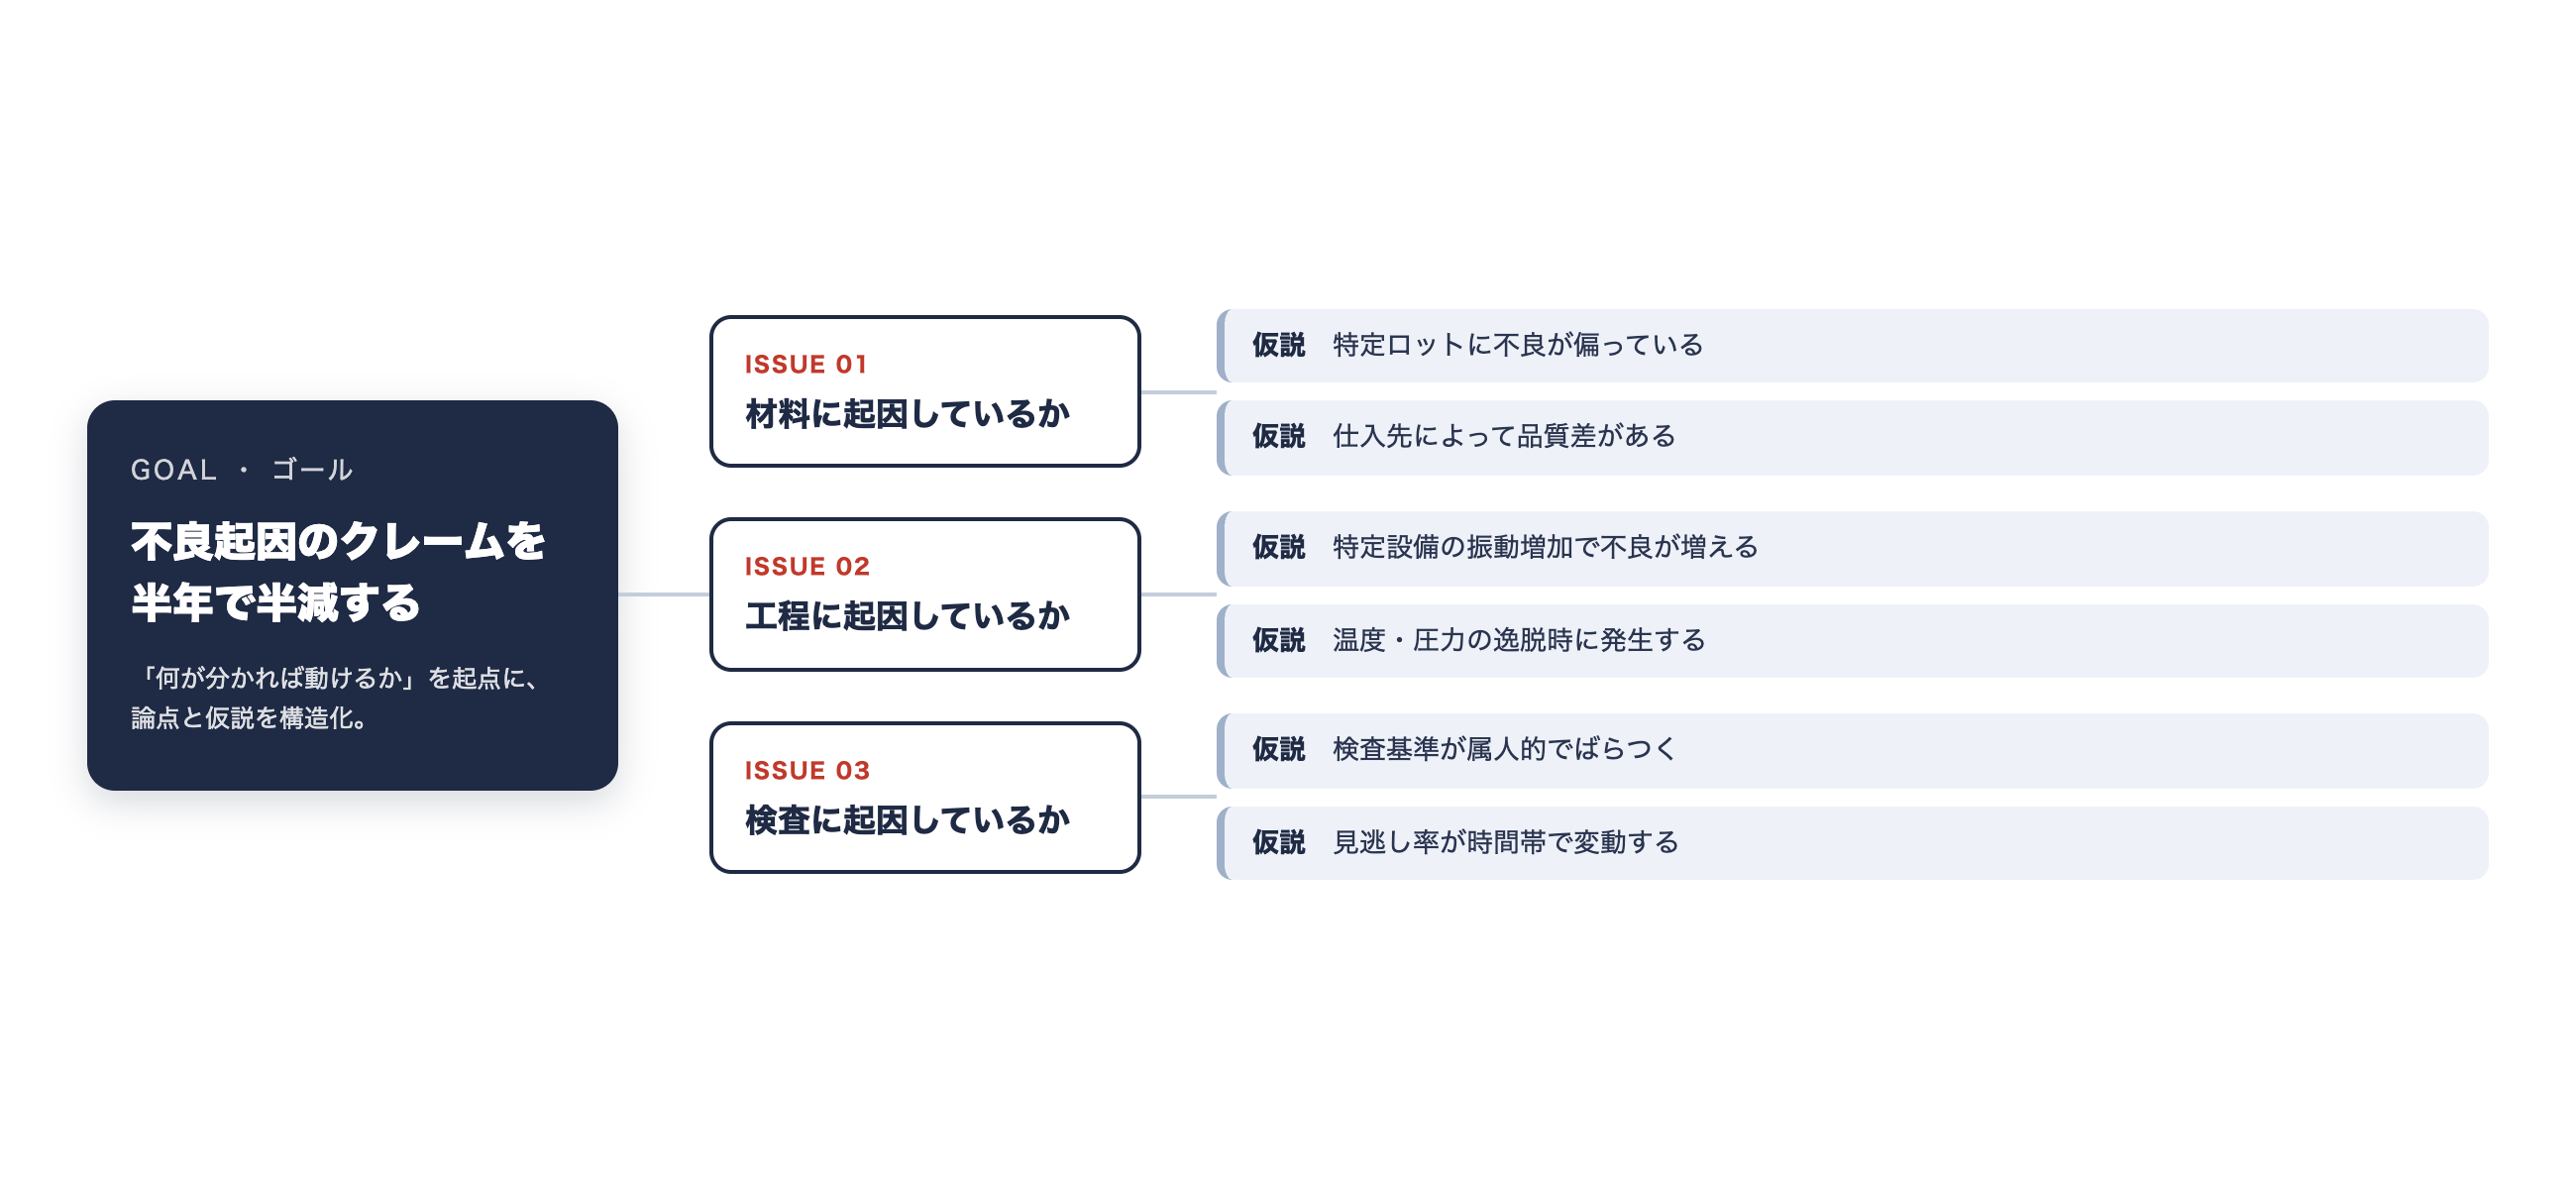
From goal-setting to results
On top of clean, shared data, our consultants now work alongside you, made to order. The problems tools can't handle, the projects where no one knows what to look at—we run them together from goal-setting to results.
Six steps of analysis that delivers
Define the goal
Put the decision and KGI into words: what, once known, lets you act?
Break it down with an issue tree
Decompose the questions MECE and structure what must be answered
Form promising hypotheses
Prioritise by impact × ease of verification
Verify with data
Test hypotheses on the clean foundation—visualisation, statistics, models
Consolidate the findings
Report what was learned, its significance, and recommended actions
To business results
Stay alongside through execution, measurement and improvement
TOOL ・ AI-AUTOMATED DATA ANALYSIS
AI runs it—from analysis to the finished report
Answer the question “what is the business goal?” and AI proceeds automatically through script generation, execution and reporting. Reproducible analysis, run on site, without specialists—across industries.
Pick a goal
Equipment improvement / failure (defect) prediction / cost & effort prediction
Pick an approach
Explanation-first (why it happens) or accuracy-first (maximise predictive accuracy)
Confirm the target variable
e.g. failure occurrence or defect rate; remaining columns become features
Auto-generate the script
Reproducible Python, generated to a naming convention
Run and visualise
Scatter plots, histograms, statistical tests / confusion matrix, ROC, feature importance
AI writes the report
Findings, significance and recommended actions, output as Markdown
Two modes and deliverables
Explanation-first
Interpret root causes with visualisation and tests (t-test, Mann-Whitney, ANOVA + effect size)
Accuracy-first
Maximise accuracy with RandomForest etc.; feature importance still shows the drivers
Deliverables
Reproducible .py + charts + a report with recommended actions
On-site operation
Edit and re-run the scripts; keep improving on your own data
Cases: site improvement through defect detection & failure prediction
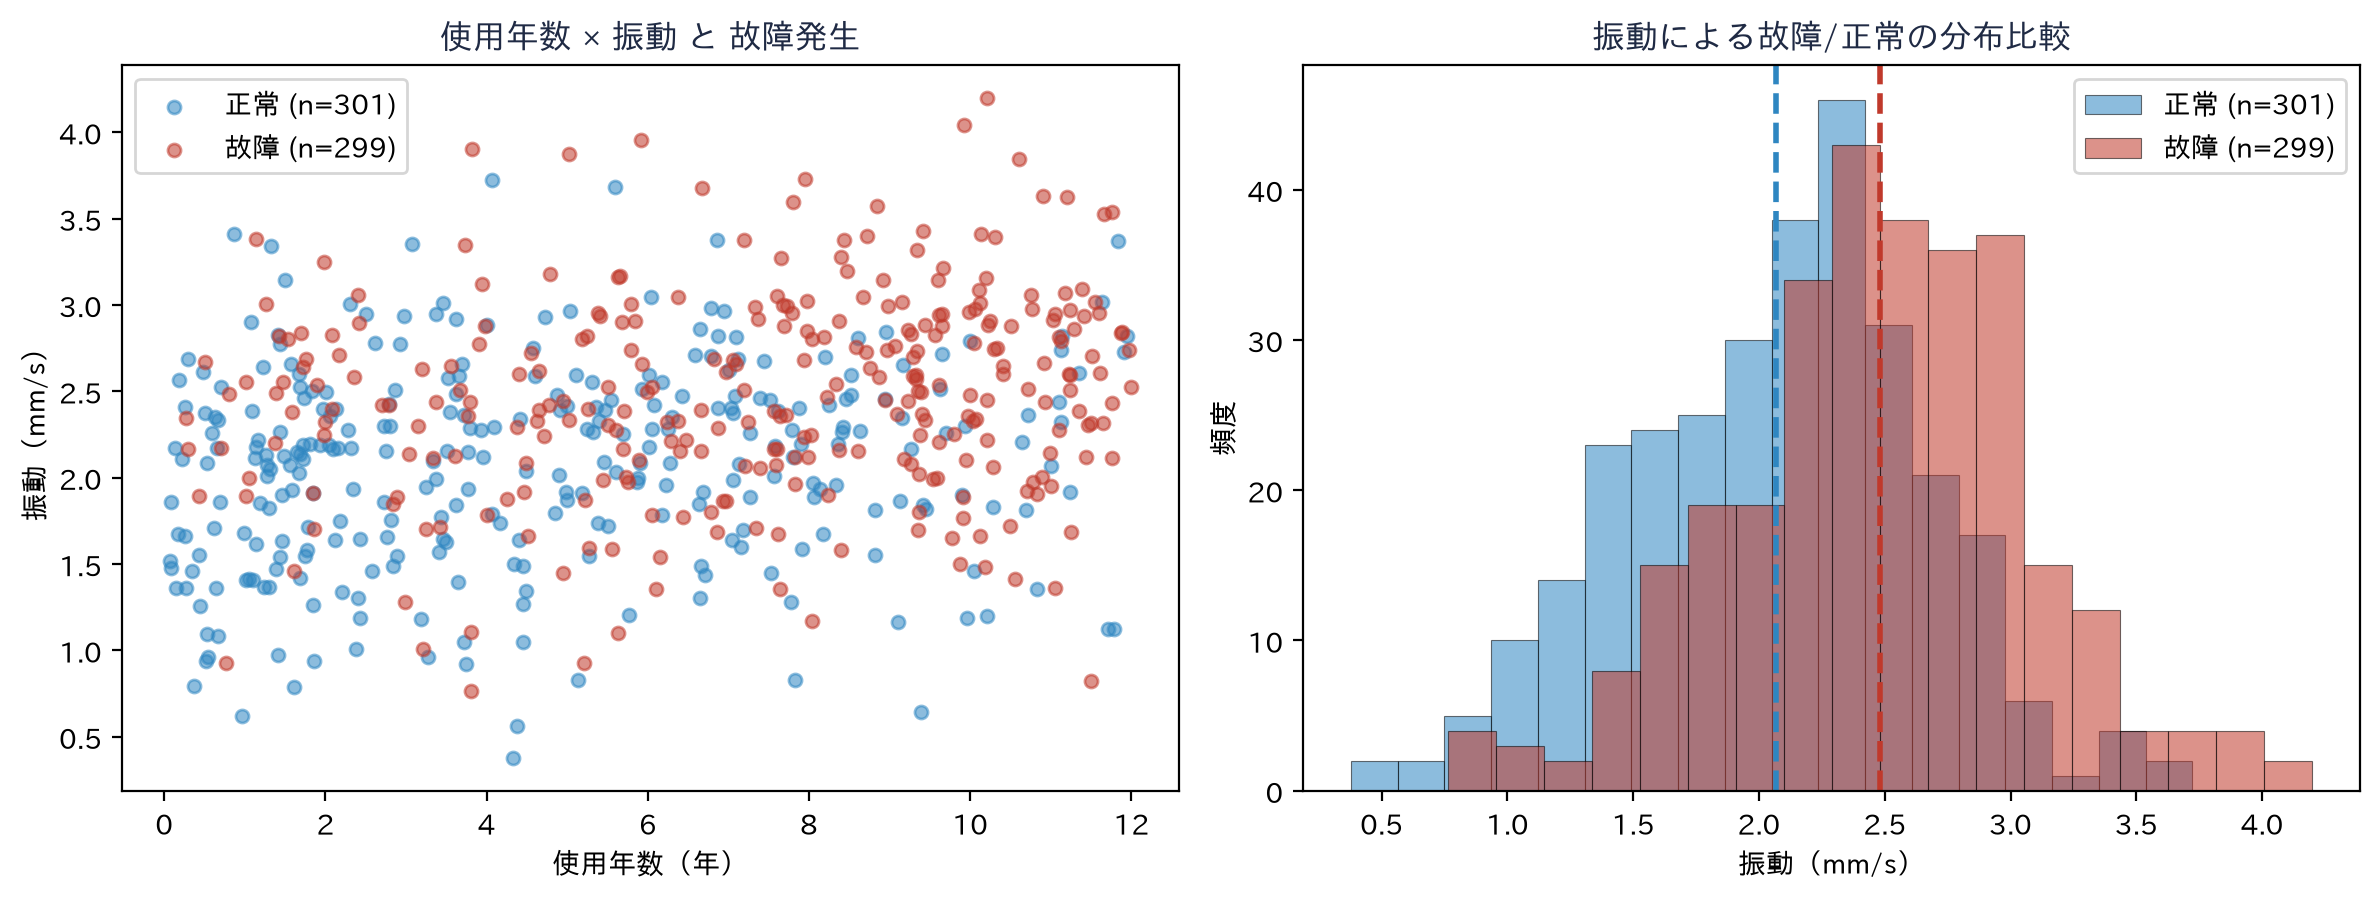
CASE 01 ・ A chemical manufacturer
Explanation-first—pinpointing the true cause of defects
The defect rate wouldn't come down and the cause was unknown. Visualising and testing defect occurrence against temperature, pressure and vibration showed defects spike once vibration crosses a threshold—and the process parameters were corrected.
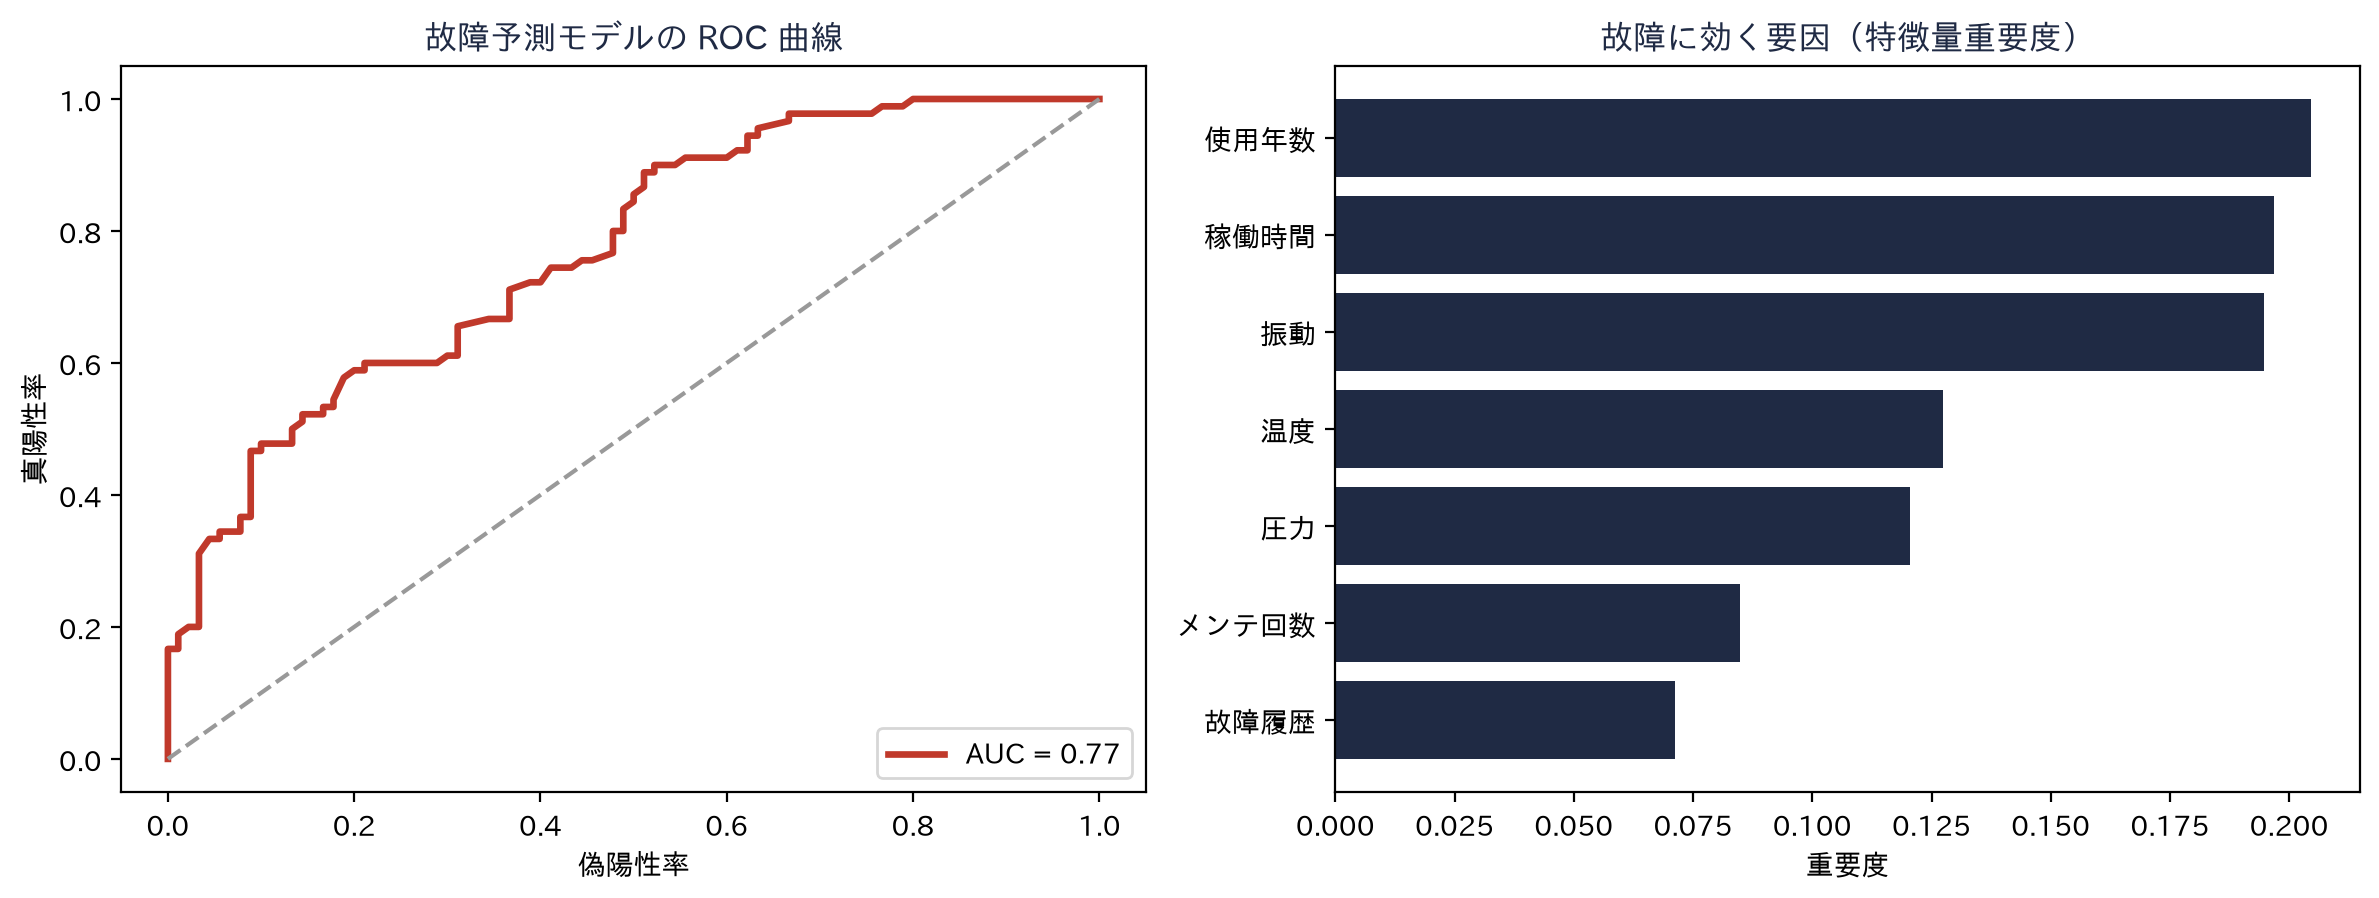
CASE 02 ・ A parts manufacturer
Accuracy-first—preventive maintenance before the breakdown
The goal: fewer sudden stoppages. A RandomForest model predicted failures, and feature importance showed age × operating hours as the main driver—so maintenance switched to acting on early signs.
WHY IPLoT
One partner from data preparation onward
When the hands-on service fits
- Data is scattered and no one has the hours to clean it—every report means re-aggregating
- What to analyse for a decision hasn't been put into words yet
- You want to end the arguments about which number is correct
- You want the lasting mechanism, not a one-off analysis
How we proceed
Inventory & goal alignment
Map what exists where; align on the decision to make and the KGI
Build the foundation
Collection, deduping, cleansing, unified format, pipeline
Analyse & verify
Hypothesis testing, visualisation and modelling on the clean foundation
Report & actions
Present the findings and recommended actions
Embed & improve
Put it into operation and keep improving it as a mechanism that stays clean
Why IPLoT
We take on the foundation too
Collection, preparation, integration and pipeline for scattered data—handled end to end
Consulting × AI implementation
One team from framing the questions through analysis, implementation and operations
A systematised method
Issue trees and hypothesis testing honed in our training business—designed from the question
Alongside you to results
Not just visibility: moves and measured effects on top of a clean foundation
IPLoT METHOD
From finding the problem to running it—one continuous flow.
While other firms take on just “development” or just “maintenance,” IPLoT delivers all three as one: (1) problem discovery & consulting, (2) development powered by generative AI, and (3) post-launch operations. The map below shows where each of our services sits across these three pillars.
Three parts, one offering: Discover → Build → Operate
Problem discovery & consulting
Before “what to build,” we ask “what is the real problem.” A standardized method distilled from our 36 in-house courses structures the issues on the ground.
IT consulting
Design from the goal with a standard method
AI Data Analysis
Store and clean scattered data, then turn it into action
Competitive Foundation Consulting
Verbalize know-how and implement it in AI
Development
We make the most of generative AI to go from requirements to implementation fast and at lower cost.
Operations & maintenance
We don’t just ship and leave. We keep watching the live system through its operation logs and keep improving it.
Every phase does not have to be ours. We agree the split of responsibilities—and how records are shared—with you and your existing vendors, and keep the information connected.
How we differ from a typical dev firm
| Aspect | A typical dev firm | IPLoT |
|---|---|---|
| Entry point | Builds what it’s told (spec-first) | Starts from problem discovery & consulting |
| Consulting | Relies on the individual’s experience | Repeatable via a standard method (36 courses) + Brain Pro |
| Development | Cost piles up with man-hours | Compresses build cost with generative AI |
| Operations | Passive—fixes things once they break | Menta-kun watches and proposes improvements proactively |
| Delivery | Split by phase, with gaps at the seams | One team, from discovery through operations |
“A typical dev firm” describes what commonly happens when phases are split between parties; it does not refer to any specific company.
FAQ
Frequently Asked Questions
Anything that already accumulates through daily operations—machine logs, inspection records, orders, inventory, production records. A CSV export from your core system is enough. It does not need to be cleaned up for analysis; raw data with gaps and inconsistent notation is fine. If it is scattered, we take on the collection and preparation (data-foundation building) as well.
If you need to sort out how your data is stored, or still need to decide what to look at, choose the hands-on consulting. For routine analysis you want AI to run automatically, choose the tool. It is fine to start from the “what should we even analyse?” stage.
Yes. You can stop at the report. If a clear improvement emerges, the same team can carry it through to requirements, development and operations.
It depends on the volume and scope. The tools are available on a monthly basis; for the hands-on consulting, an initial analysis typically takes a few weeks. We also handle narrower spot analyses. Please contact us for details.
That is fine. The tools guide you from questions to a finished report. In the hands-on consulting we do the analysis and report what is happening and what to do next, in the language of your business. You receive the scripts as well, so your team can reproduce and continue the work.